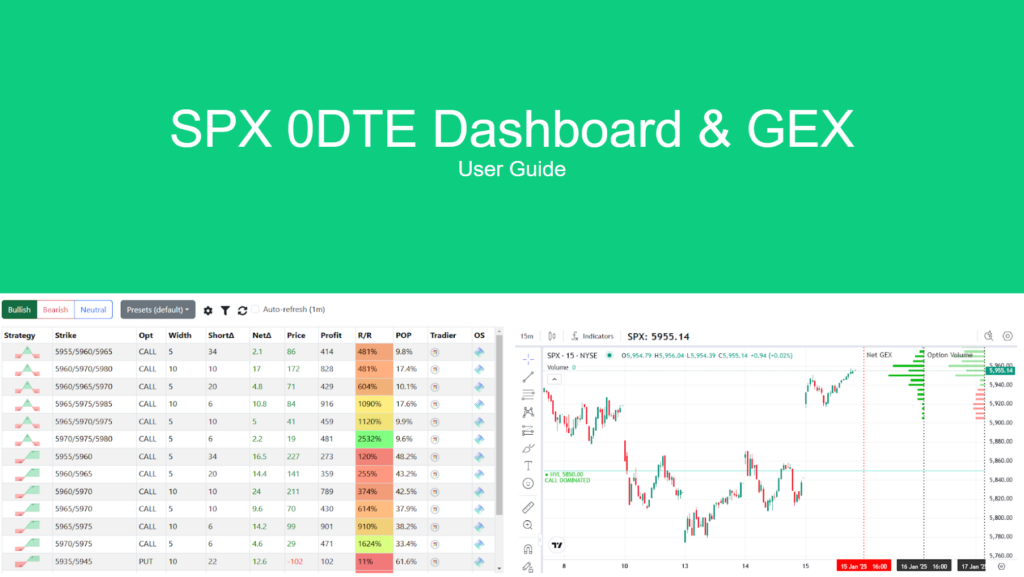
🚀 Are you trading SPX 0DTE options and looking for an edge? Meet the SPX 0DTE Dashboard, a powerful tool designed to help you make smarter, data-driven trades faster and more efficiently.
With market insights, gamma exposure metrics, and advanced filtering, this dashboard allows traders to quickly identify high-probability setups without the usual guesswork.
📺 Watch the full tutorial below:
Why SPX 0DTE Trading Requires the Right Tools
SPX 0DTE options are unique—they expire the same day, making them incredibly fast-moving. Unlike swing trading or traditional options strategies, 0DTE traders need to analyze and execute trades within minutes.
This guide will show you how the SPX 0DTE Dashboard can help you:
✅ Track real-time gamma exposure (NetGEX) and option volume
✅ Filter and customize spreads instantly
✅ Visualize trades directly on a TradingView chart
✅ Identify key market levels and breakeven points
Let’s dive in!
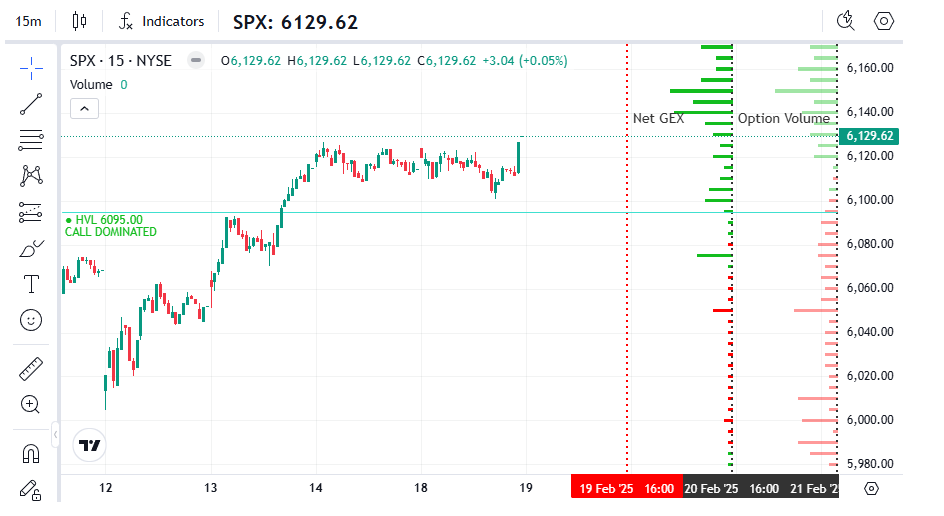
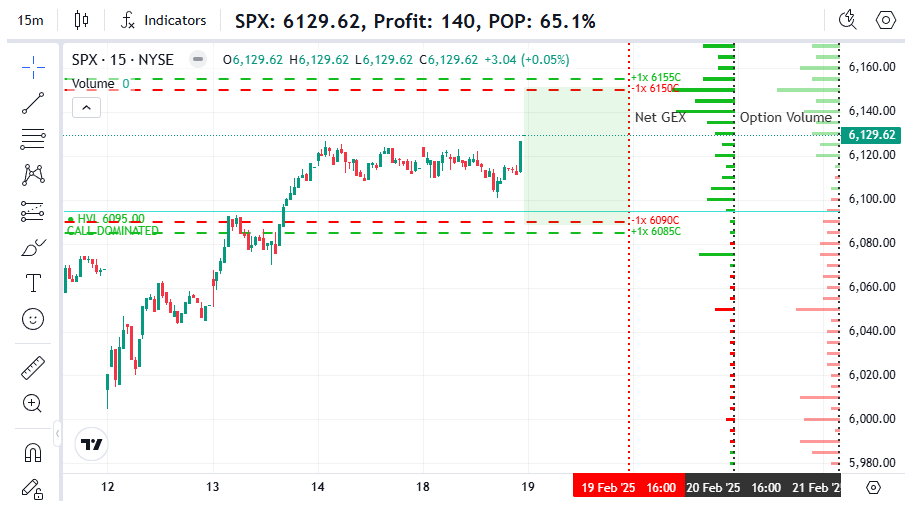
Step 1: Understanding the TradingView Chart
The dashboard includes an embedded TradingView chart displaying SPX price movements in 15-minute intervals.
📌 Key elements on the chart:
- Blue horizontal line: High Volatility Level (HVL) – helps determine whether call or put dominance is present.
- Green & red bars: Indicate NetGEX values, showing gamma exposure at different strikes.
- Dynamic trade markers: Highlight selected strategies on the chart.
Step 2: Analyzing Key Metrics (NetGEX & Option Volume)
To make quick trading decisions, you need to know where market makers are positioned.
🔹 NetGEX (Net Gamma Exposure)
- Green bars: Call gamma dominance → bullish pressure
- Red bars: Put gamma dominance → bearish pressure
🔹 Option Volume
- Green bars: More calls traded than puts
- Red bars: More puts traded than calls
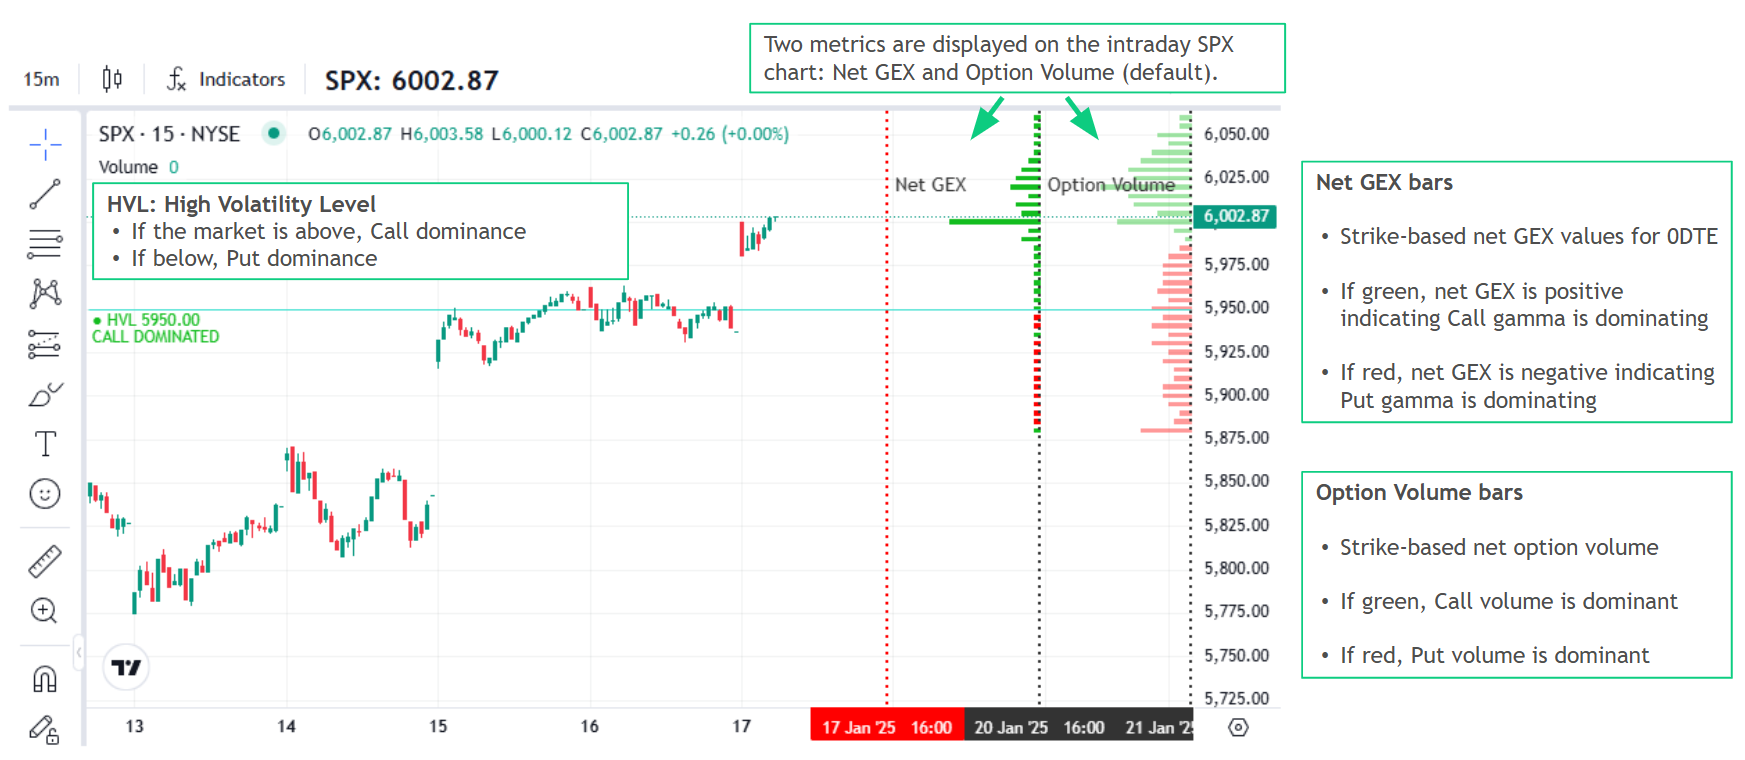
These indicators update every minute, ensuring that you’re always trading with the latest market data.
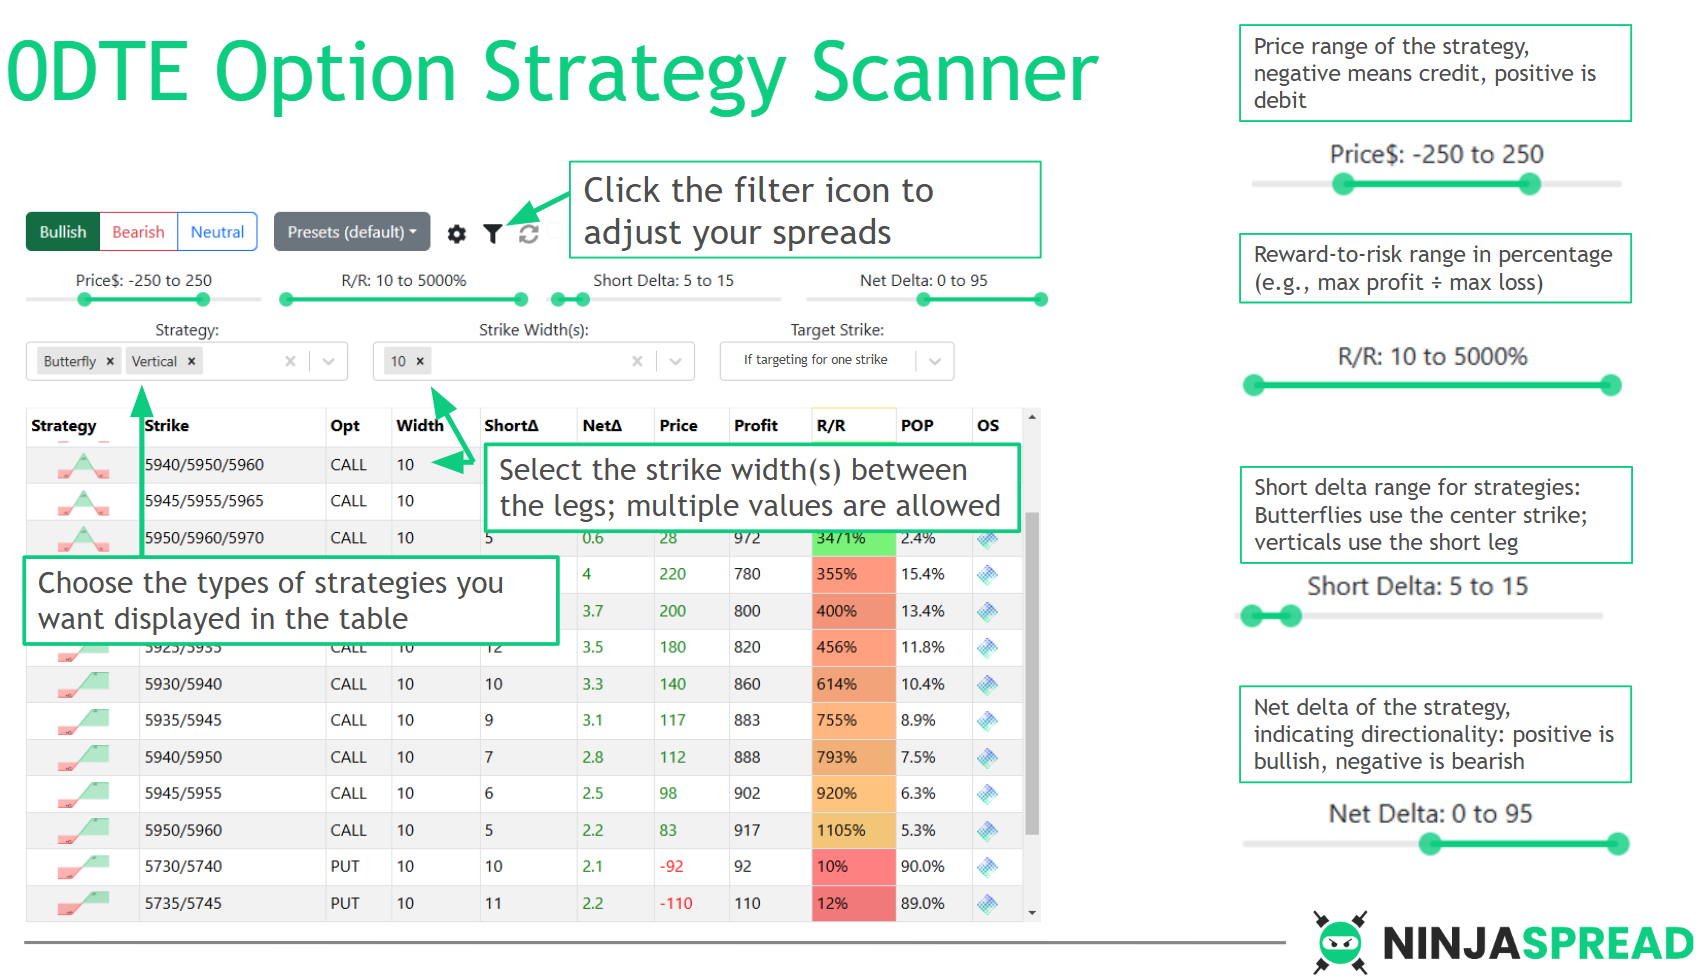
Step 3: Filtering and Customizing Option Spreads
The SPX 0DTE Dashboard simplifies spread selection by categorizing strategies into bullish, bearish, and neutral.
🛠️ How to filter spreads:
1️⃣ Click “Show/Hide Filters”
2️⃣ Select your preferred spread type (Butterfly, Vertical, Iron Condor, etc.)
3️⃣ Adjust settings like strike width, price range, reward-to-risk ratio, and delta
💡 Example: Want to find a bullish butterfly under $100 with a reward-to-risk ratio above 1000%? Just set the filters, and the dashboard will instantly narrow down your options.
Step 4: Visualizing Trades on the Chart
Once you’ve selected a spread, you can instantly see its breakeven levels and risk zones plotted directly on the TradingView chart.
📌 Key trade visualization features:
✅ Strike prices are marked dynamically
✅ Green zones indicate profit potential
✅ Quick-reference breakeven levels
Clicking on any trade will update the chart to reflect your chosen strategy.
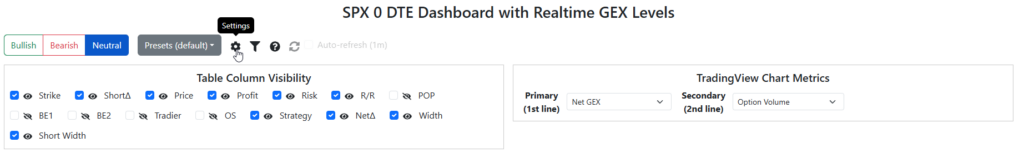
Step 5: Fine-Tuning the Dashboard Settings
For maximum customization, the SPX 0DTE Dashboard lets you:
🔹 Enable/disable specific columns (Probability of Profit, Open Interest, etc.)
🔹 Adjust primary and secondary metrics (NetGEX, Option Volume, Open Interest)
🔹 Auto-fill trades into Tradier for seamless execution
🛠️ To access these settings, simply click the Settings button in the top menu.
Final Thoughts: Why This Dashboard is a Game-Changer
🔹 No more manual options chain scanning – find trades instantly
🔹 Real-time market insights – always trade with fresh data
🔹 Advanced strategy filtering – only see the best opportunities
🔹 Seamless TradingView integration – visualize trades like never before
📢 Try the SPX 0DTE Dashboard today and start making more confident, data-driven trades!
Here is a presentation of all the features.