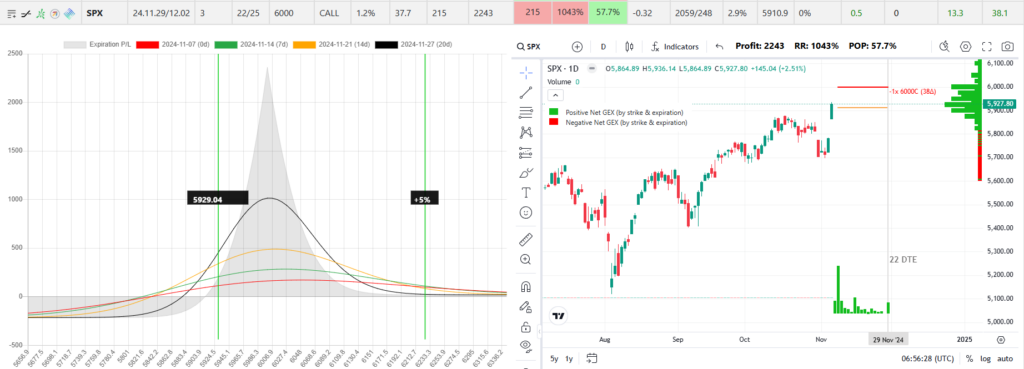
We’re thrilled to announce a significant new feature in NinjaSpread, one that’s set to elevate how options traders visualize and analyze their strategies. With this update, we’ve integrated TradingView’s robust charting tools directly into NinjaSpread, enabling dynamic visualizations that bring clarity to even the most complex strategies.
Why Strategy Visualization Matters in Options Trading
In options trading, finding the right strategy and understanding its potential outcomes can be challenging, especially when managing multiple positions across different expiration dates and strikes. With the new NinjaSpread update, you can now visualize your chosen strategies, complete with critical data points like risk profiles, target prices, strikes, break-even points, and the probability of profit (POP). This feature brings all essential strategy insights into one view, streamlining analysis and enabling quicker, more confident decision-making.
For instance, consider an SPX Call Calendar spread. Now, within seconds, you can see:
- Risk Profile and Price Chart: Your selected option’s risk and profit zones displayed alongside the underlying price chart, helping you instantly assess market fit.
- Key Indicators: The expiration date (marked with a gray vertical line), break-even points (in orange), and target price strike (in red) are all displayed, highlighting where the strategy stands within your market outlook.

This upgrade means less time on manual analysis and more time on strategic positioning.
NetGEX: Analyzing Market Sentiment with Gamma Exposure
One of the standout features of this update is the integration of NetGEX (Net Gamma Exposure), which offers a new level of insight into market sentiment. NetGEX goes beyond simple volume or open interest metrics; it calculates cumulative gamma exposure across different strikes and expiration dates. This can reveal essential levels of resistance and support based on positive or negative gamma levels, offering insight into how volatility may impact the underlying asset.
In simple terms:
- Positive Gamma (green bars) tends to dampen volatility, providing more stable price movement.
- Negative Gamma (red bars) can amplify volatility, potentially leading to larger price swings.
With NetGEX, you can better understand where the market might expect resistance or support and position your trades accordingly.
POP Calculation: A Quick Read on Profitability
In addition to risk visualization, every strategy now displays the probability of profit (POP) — an estimate of the likelihood that a trade will finish in profit by expiration. This data can save valuable time, allowing traders to spot high-probability trades that align with their goals without running extensive calculations.
Jade Lizard Visualization Example
For those using advanced strategies like the Jade Lizard, this new feature is a game-changer. NinjaSpread now includes a visual representation of this strategy, displaying short and long legs, break-even levels, and target zones. In a recent Nike (NKE) Jade Lizard example:
- High POP: The strategy’s POP is at 87.7%, meaning a strong likelihood of profitability at expiration.
- Support Visualization: The chart reveals a robust support level around 75, aligning with a larger put position based on the NetGEX.

This clarity makes it easier to assess strategy viability at a glance, positioning traders to act quickly on profitable setups.
How to Access the New Feature
To access this powerful new visualization tool, you have two options:
- Click on the Risk Graph icon within any result in the search results list to open a detailed analysis for that individual result.

- Alternatively, select the Analyze & Chart View option at the top of the table to instantly view comprehensive options and GEX visualizations across all results.

With these access points, you can seamlessly toggle between individual strategy insights and a broader market view, ensuring you have everything you need to make strategic, informed trading decisions.
Save Time, Gain Edge, and Make Informed Decisions
NinjaSpread’s latest update consolidates critical strategy insights and sentiment analysis tools into one platform. Instead of switching between various tools, traders now have all essential data in one place, enabling more efficient, informed trading decisions.
Explore NinjaSpread’s new visualization features today and experience the difference that seamless strategy insights can make!
Stay tuned for more exciting updates and improvements as we continue to make NinjaSpread the ultimate options trading scanner.